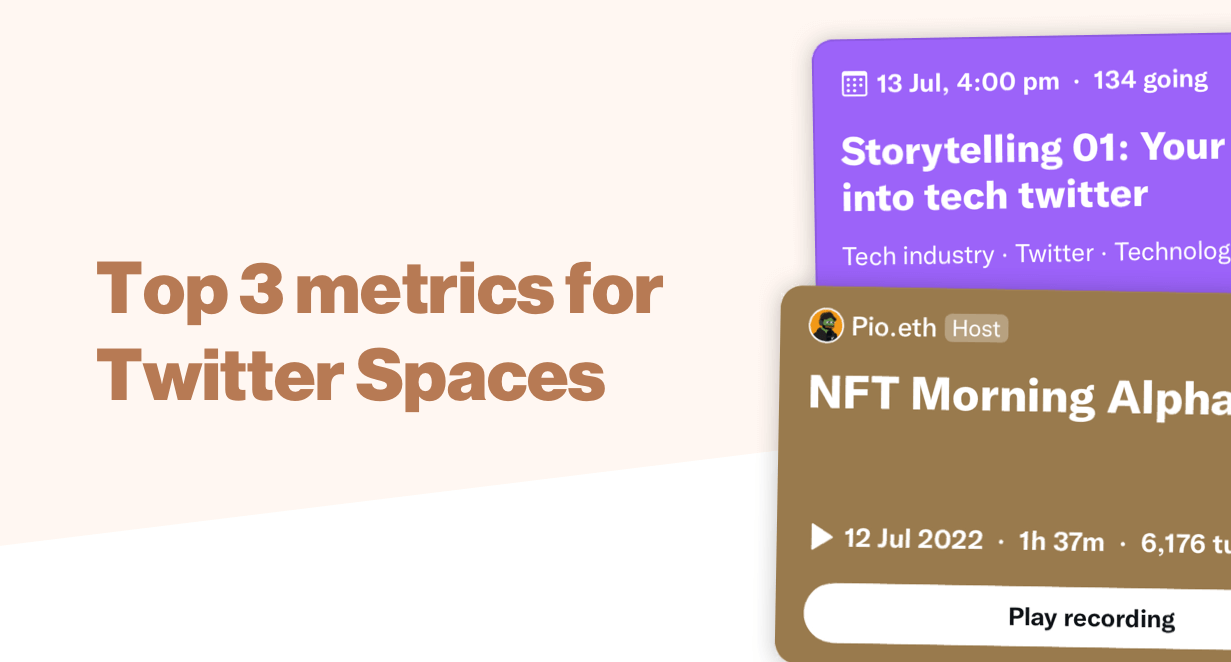
The top 3 metrics to understand your Twitter Spaces
Three important metrics to help improve community, participation and inclusivity in your Twitter Spaces.

Twitter Spaces are an amazing tool for live audio shows and conversation.
But as a host, it's hard to know how well your Spaces are going down with your audience.
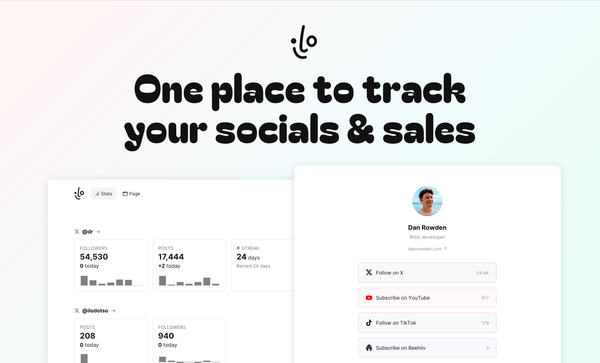
With ilo's Spaces analytics, you can now have a great overview of your Spaces both live as they happen and after they're finished.
Here are three core metrics you should be watching, comparing and analysing as you continue to host Spaces on Twitter.
Audience size
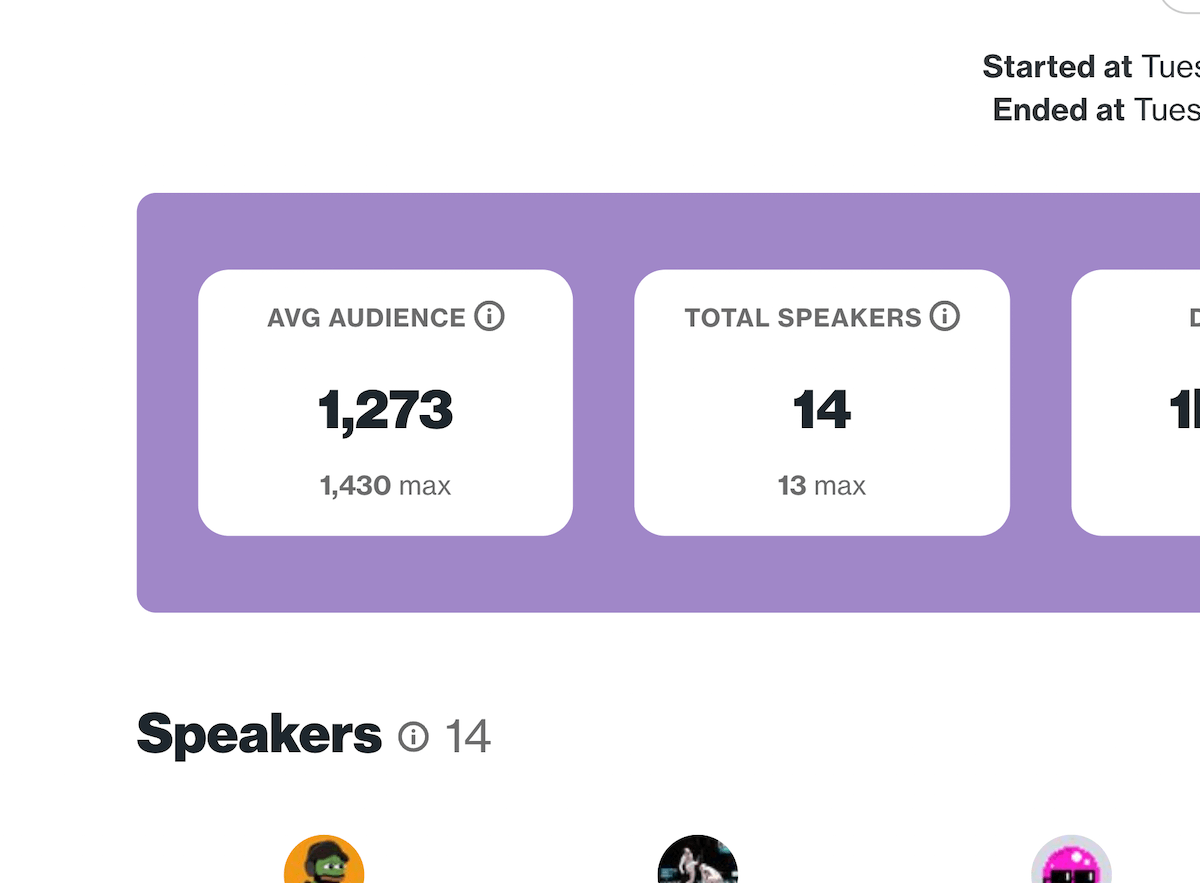
The hero metric for Spaces, audience size shows you how many people have been listening in your Space.
When in a Space, you can see a live figure showing how many people are currently listening in or speaking.
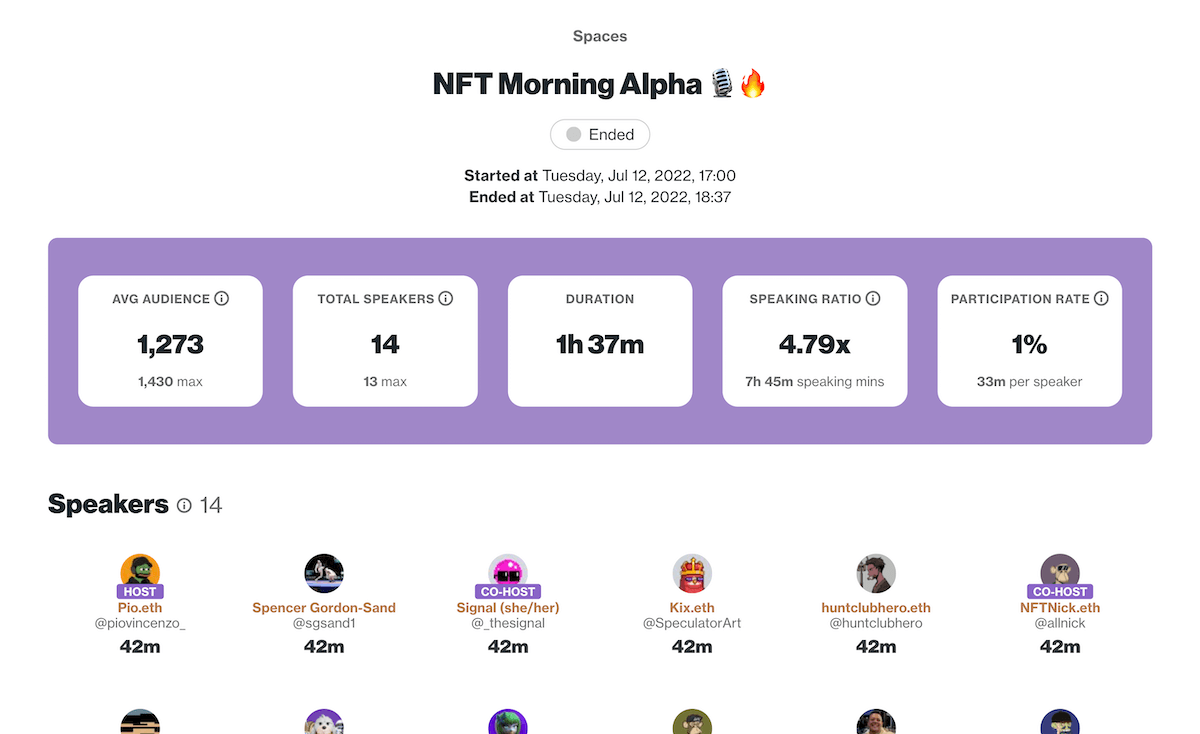
In ilo, you can see your average audience size throughout the Space plus the maximum number of people that were listening in.
A participation chart also plots your speaker and listener totals from the start of your Space to the end.
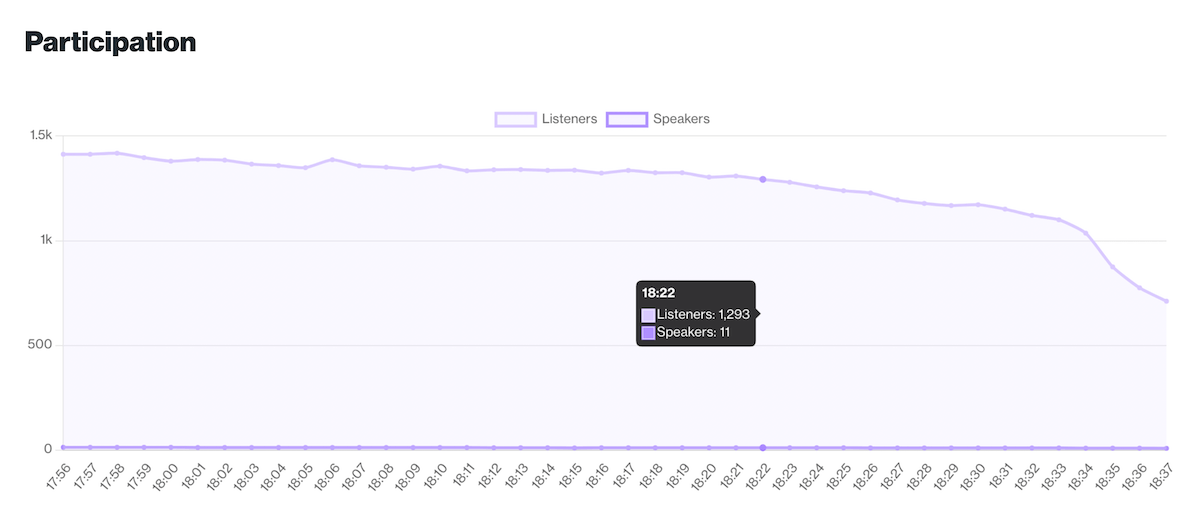
It's also possible to see just speaker totals; both Total speakers and Max speakers are tracked in ilo for each Space.
(This data can be refreshed during your Space so you always have the latest data.)
Speaking ratio
The Speaking ratio is a calculation showing how many minutes there were speakers compared to the length of your Space.
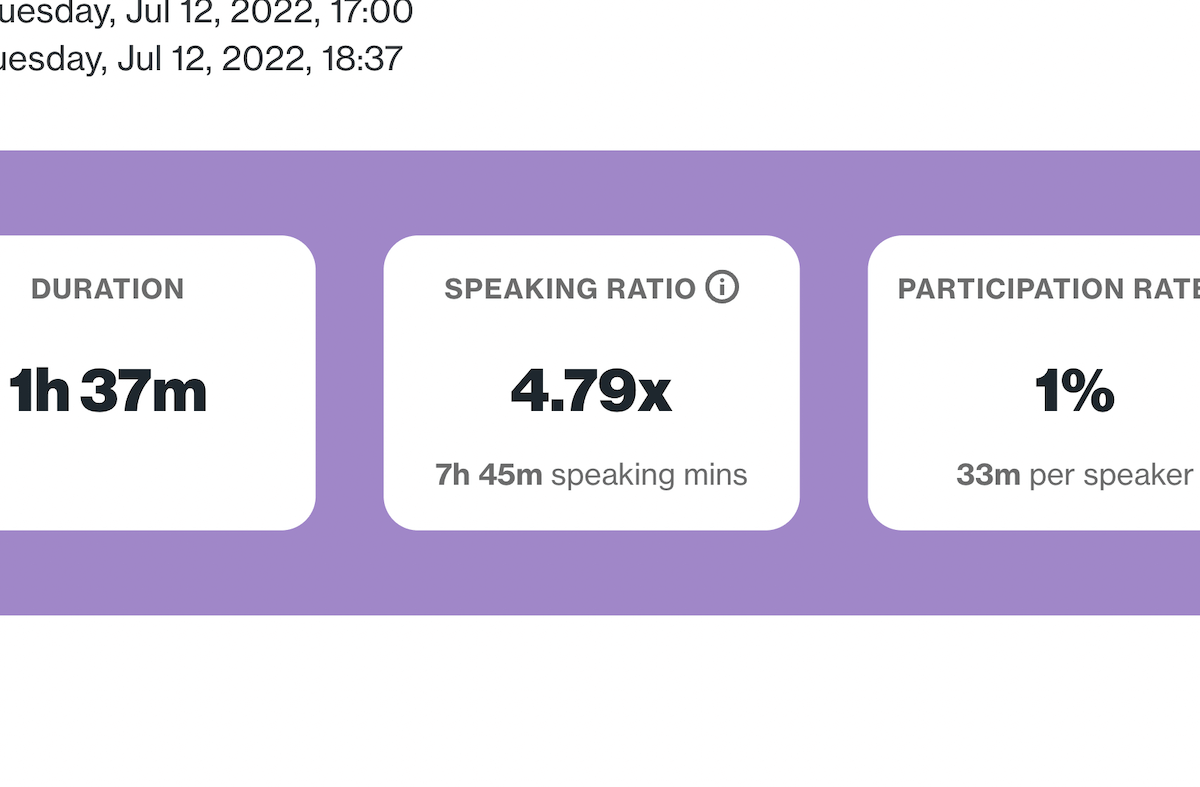
If you had 10 speakers who all spoke on average for 10 minutes each and your Space was 40 minutes long, your Speaking ratio would be 2.5x (100 speaking minutes / 40 minutes).
The more speakers you get (more diverse voices) and the longer they each speak, (more time to listen from them) the higher your Speaking ratio will be.
Over time you can easily compare your Spaces within ilo and use this metric to determine which Spaces had higher participation than others.
Participation rate
The last metric you should be looking at is participation rate. This is a simple metric which shows the percentage of total listeners who spoke in your Space.
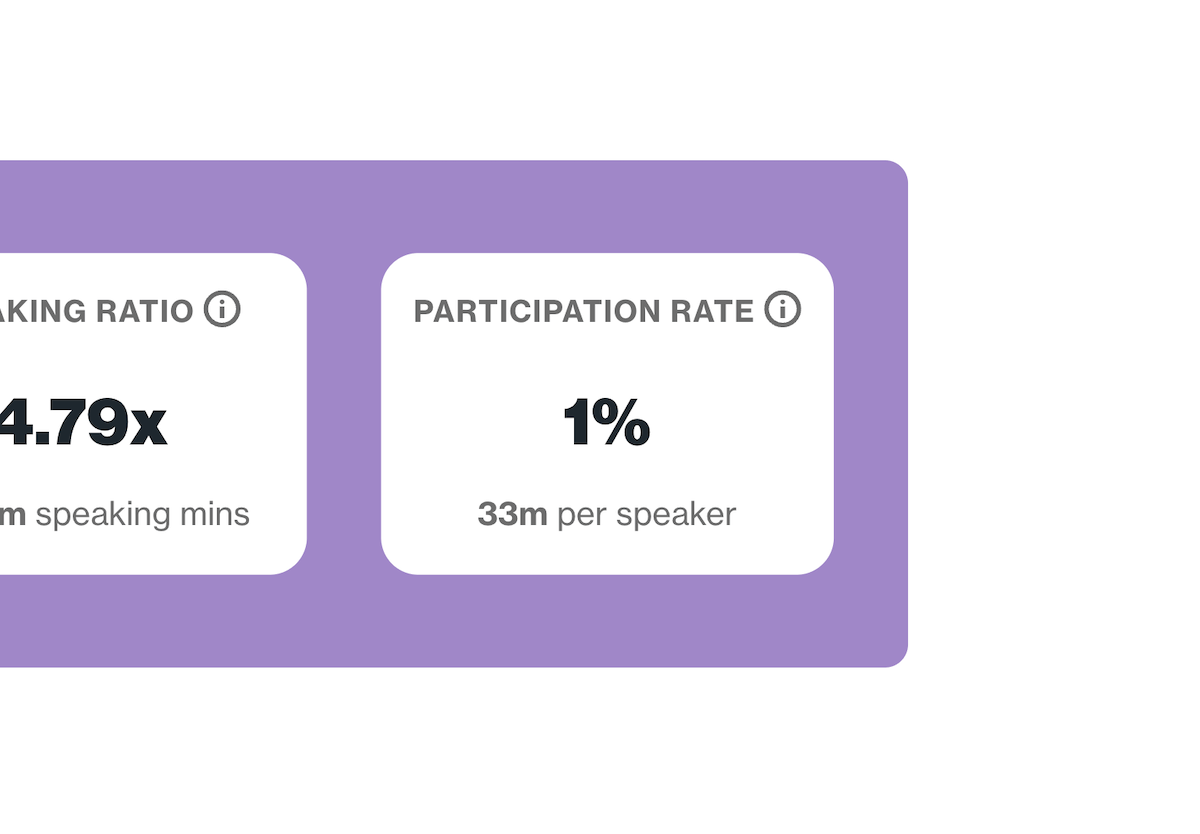
For some hosts, having fewer speakers—a low participation rate—is actually desired (think about interview shows) but if you're hosting community-led Spaces with discussions and you want participation, track this metric. You'll be able to see which Spaces you're doing better with inclusion than others.
Try out ilo Spaces analytics totally free for 14 days.