How to view analytics metrics for a single tweet
Learn how to check analytics for your tweets.
A great way to grow on Twitter is to learn how well individual tweets were received and which kind of engagement they get.
You can then hone in on your best content and try to do more of that.
Here's how you can view tweet analytics both on Twitter and within ilo.
How to view tweet analytics in Twitter
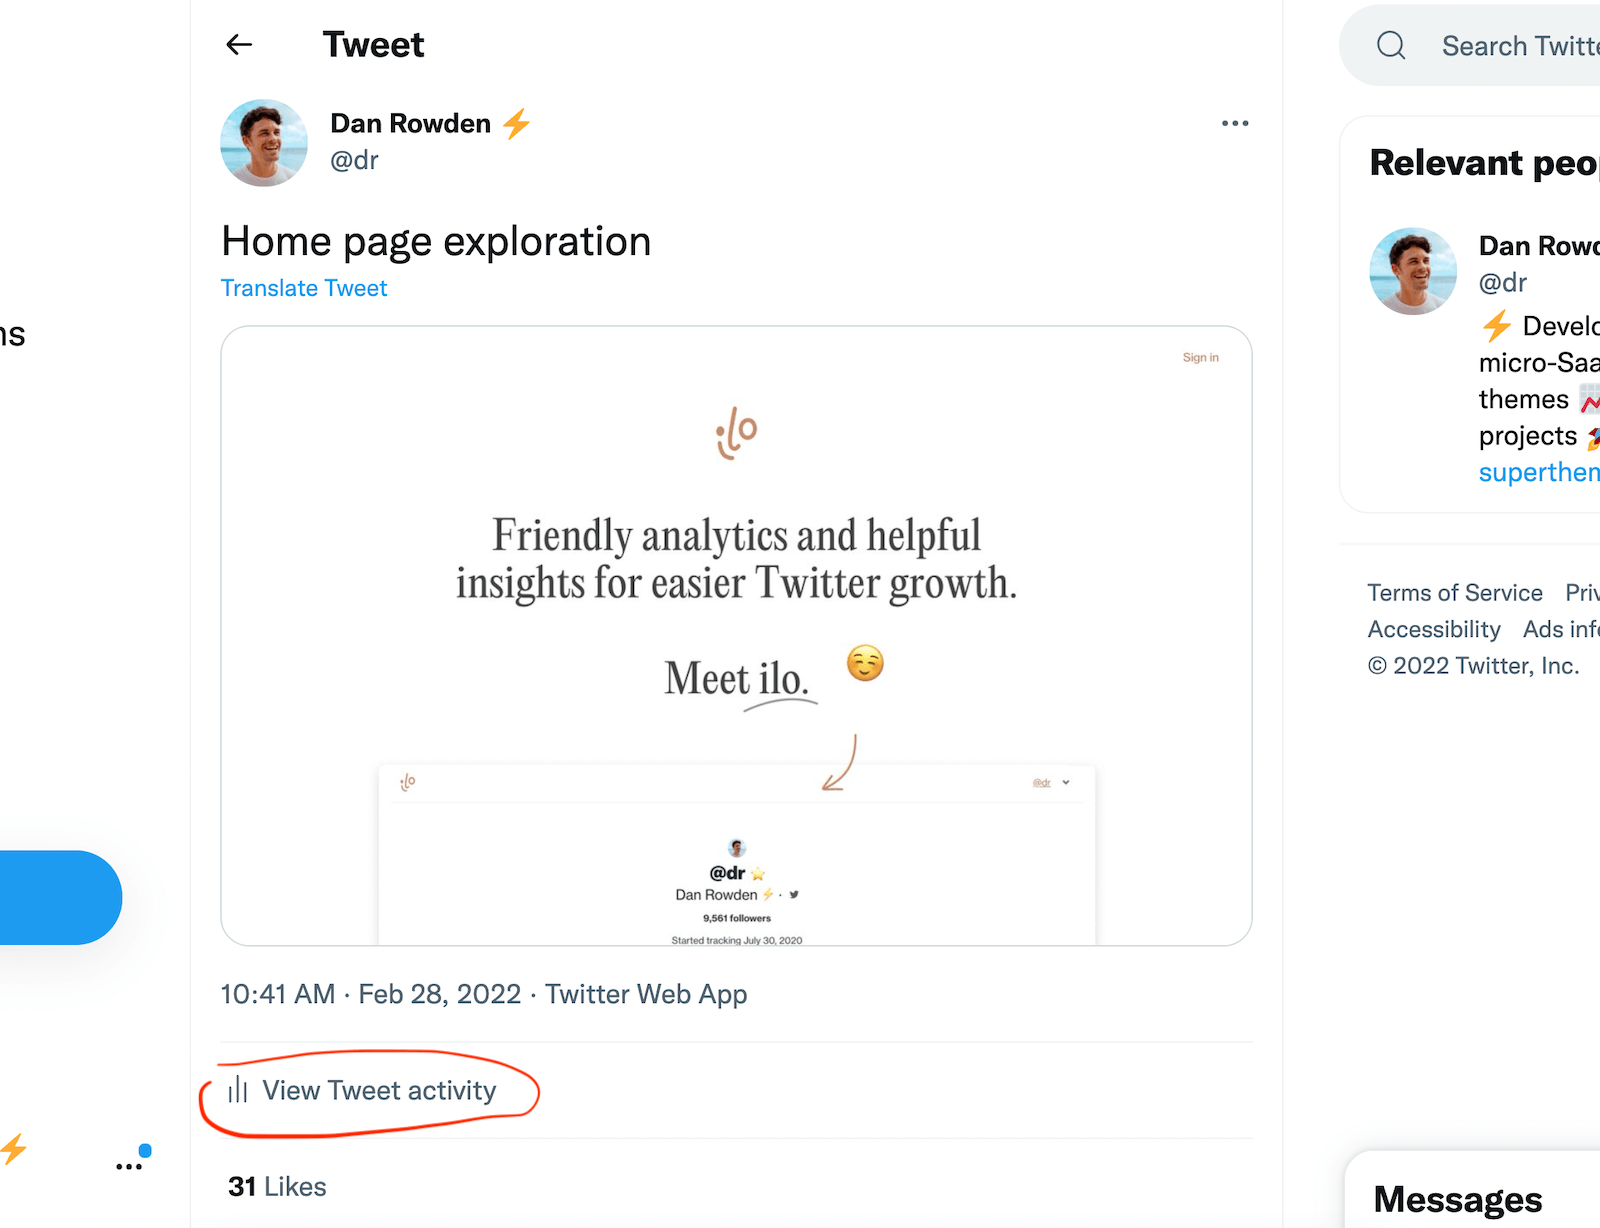
In the Twitter apps, you can easily bring up an analytics pane from any of your tweets by clicking or tapping on the chart icon beneath a tweet.

The analytics pane that appears will look like this.
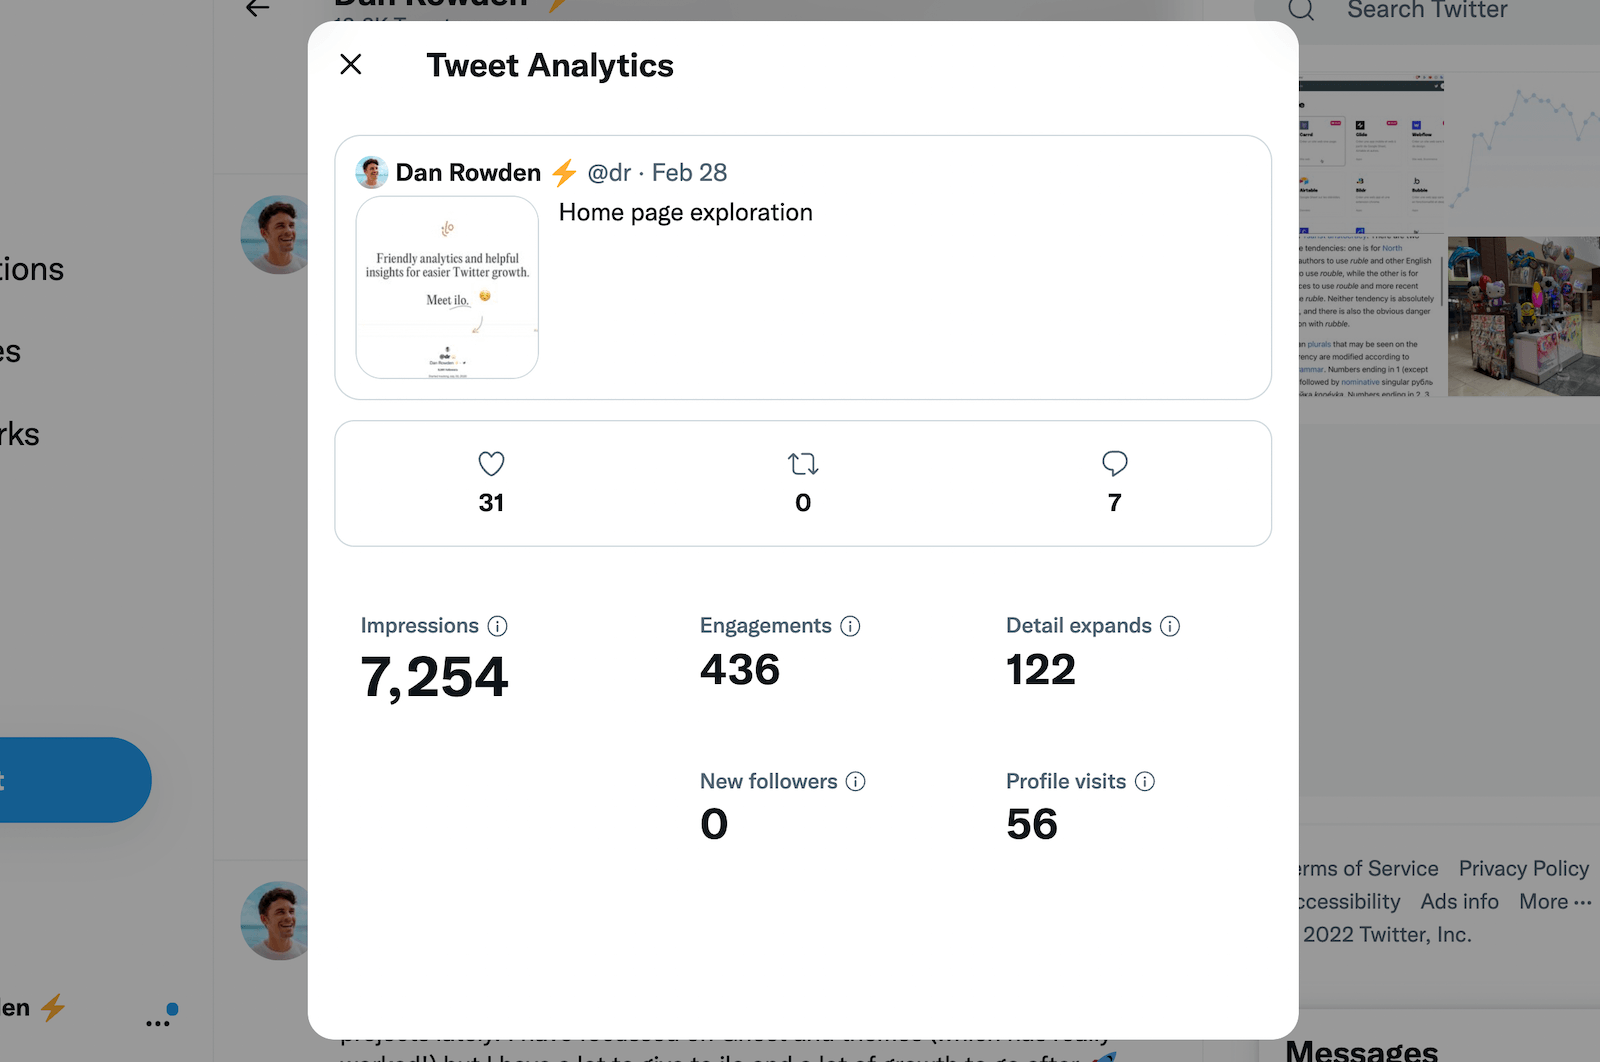
It shows you the basic public metrics (likes, retweets and replies) plus some private high-level metrics (impressions, engagements, detail expands, new followers and profile visits).
This is what the metrics represent:
- impressions: the number of times a tweet has been seen on Twitter.
- engagements: the number of different actions other users have made on your tweet.
- detail expands: the number of times a user has clicked through to your tweet.
- new followers: the number of times a user has clicked on a tweet's menu and selected "Follow user".
- profile visits: the number of times users have clicked through to your profile from the tweet.
It's worth noting here that the "engagements" that Twitter includes in the metric are not all important engagements (for example, clicking on a tweet is counted in the "detail expands" figure), and typically this number can be inflated.
This is what Twitter says it refers to as an "engagement":
This includes all clicks anywhere on the Tweet (including hashtags, links, avatar, username, and Tweet expansion), retweets, replies, follows, and likes.
Tip: The most important thing to look for here is profile visits. This shows how many times someone has clicked to your profile from your tweet to find out more. This is how you convert tweet readers into followers (read some tips about improving your Twitter bio to help with this conversion). If you're looking to grow on Twitter, you should be trying to get higher levels of profile clicks from your tweets.
How to view more detailed tweet analytics in ilo.so
ilo is a third-party analytics tool that looks at the raw data about your tweets—direct from Twitter—analyses it and displays it in more detail.
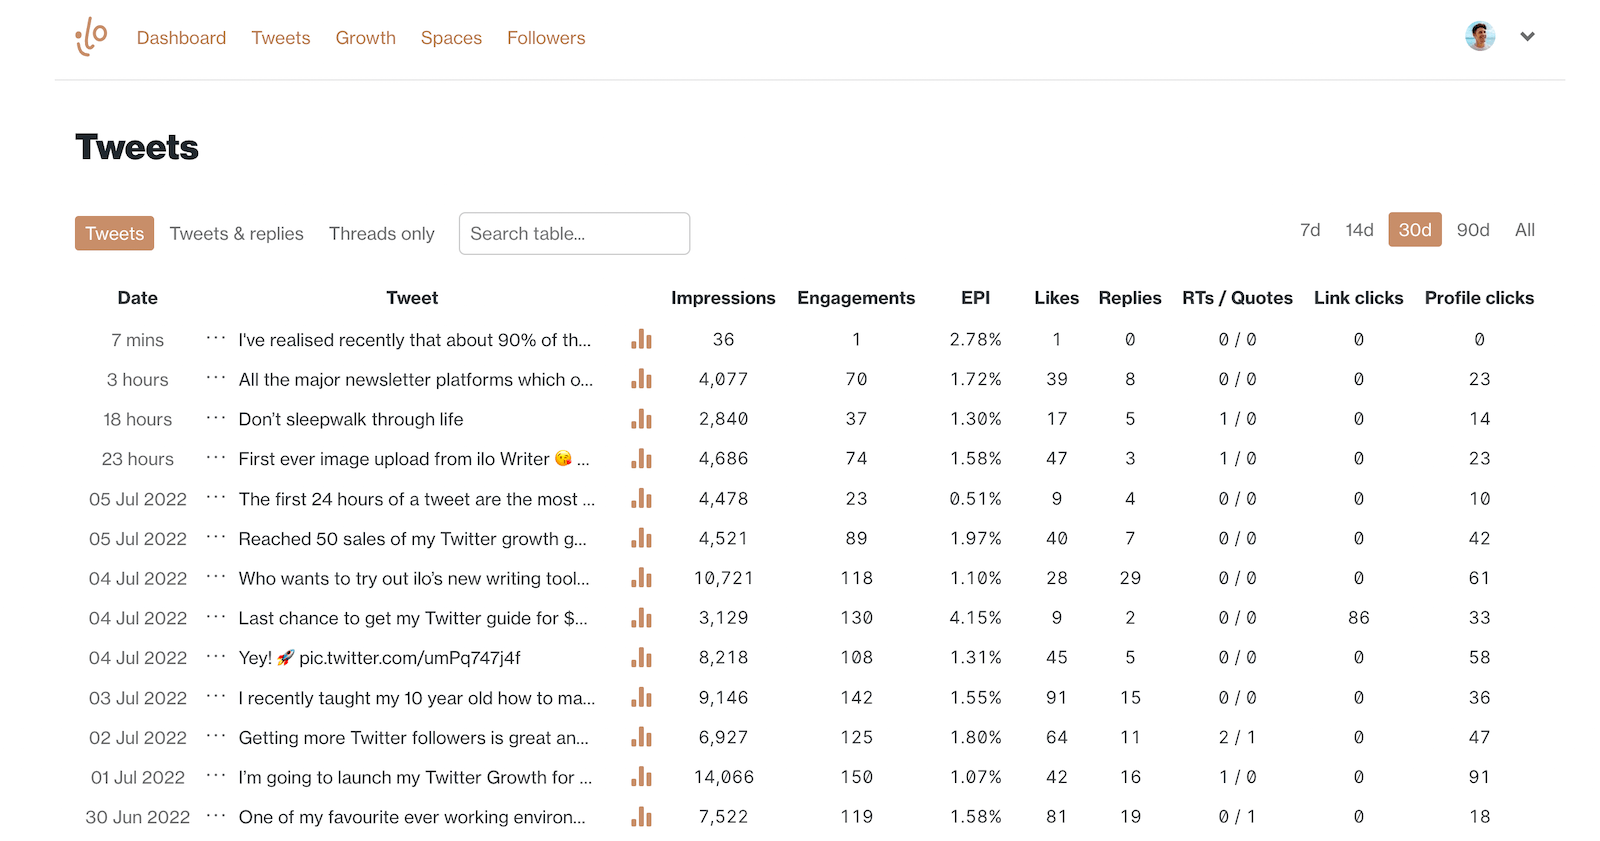
This should help you identify your top content plus monitor how your tweets are doing, so you can grow on Twitter more easily.
Once you have signed up to ilo and you want to see a tweet's analytics, you can simply replace "twitter.com" with "ilo.so" in your browser.
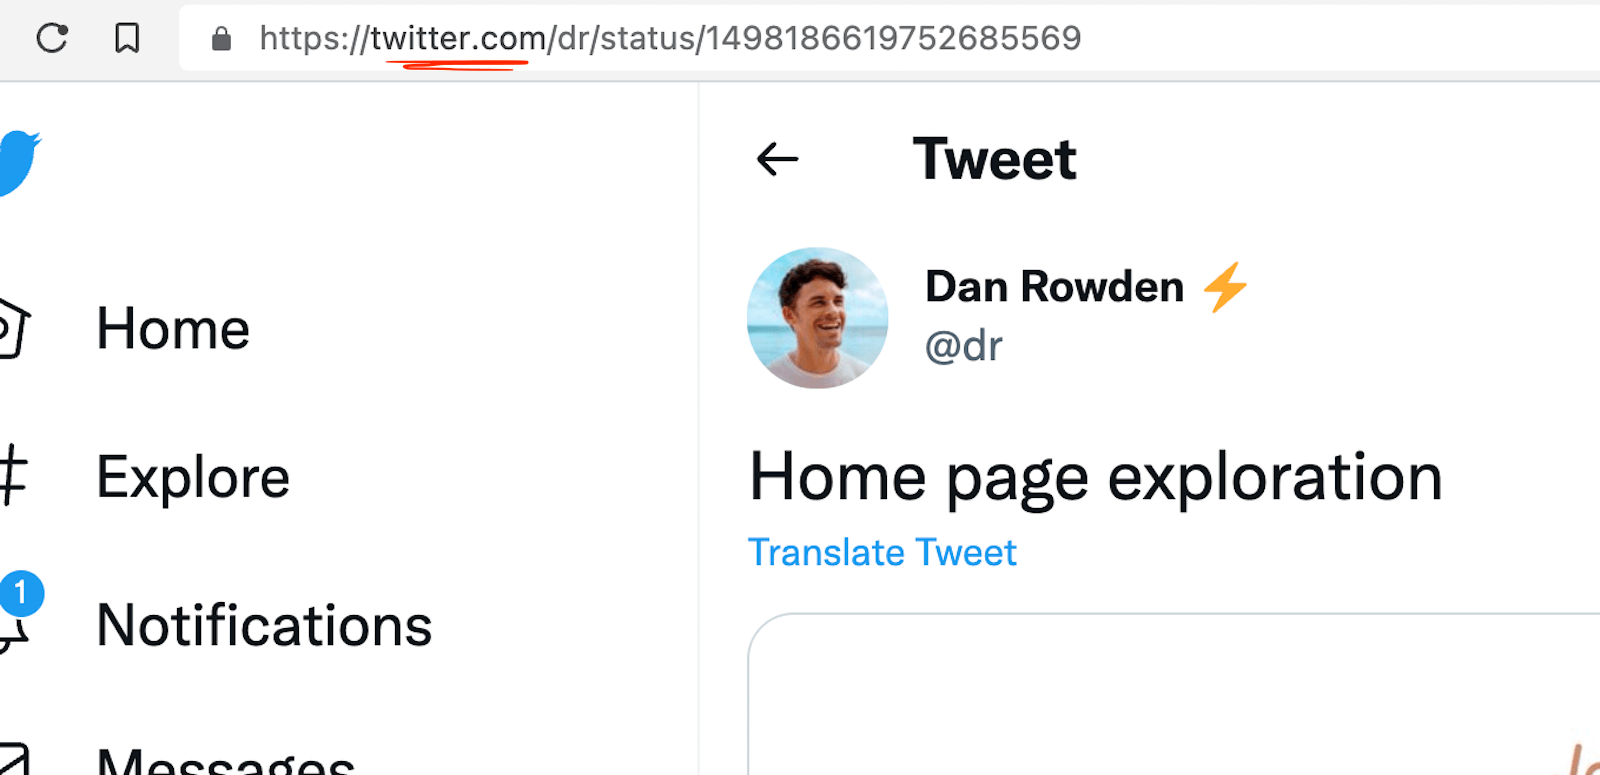
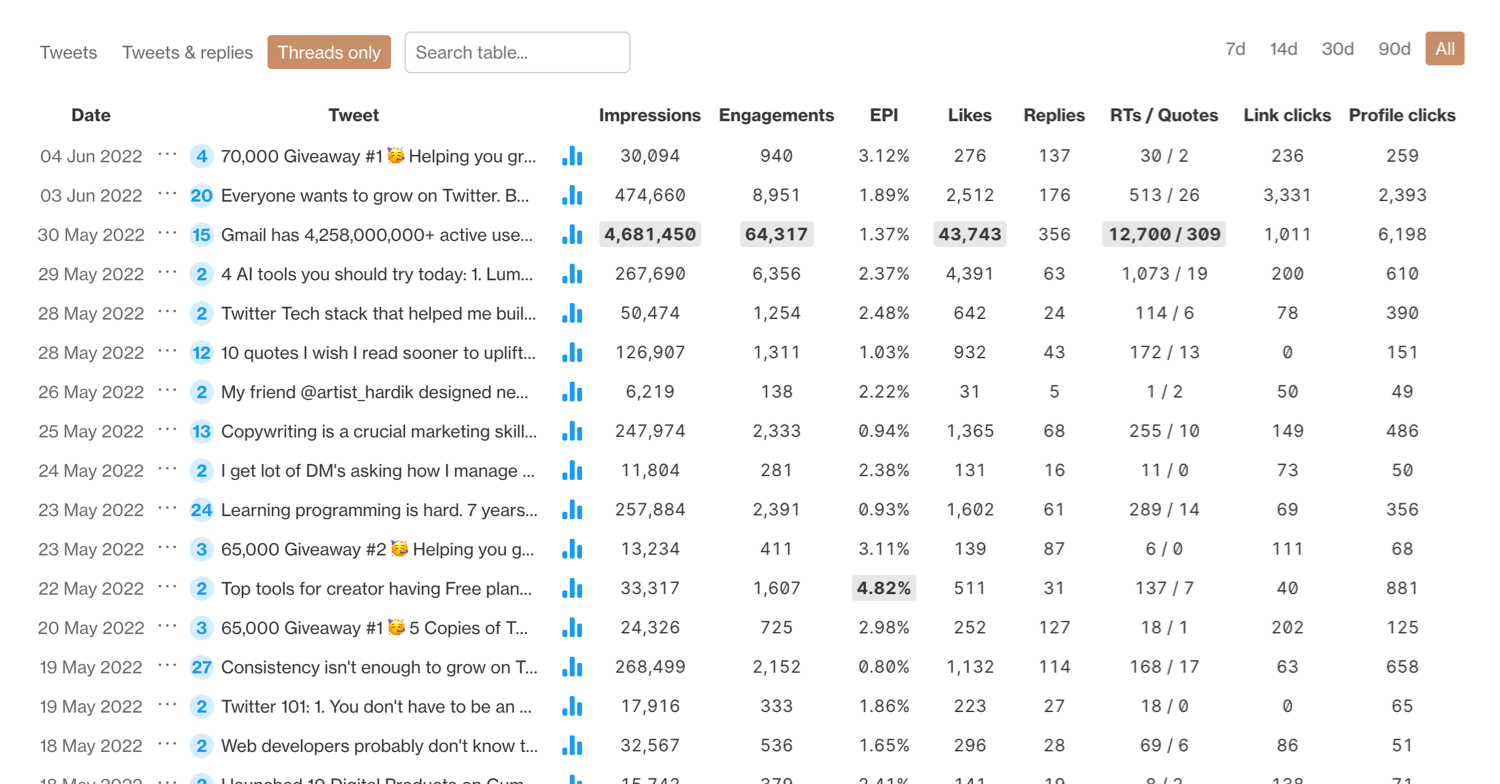
Alternatively, if you're on mobile, simply go to ilo.so in your browser and click on Tweets in the menu. This will bring up the tweet table view shown above.
Once you get to a tweet page in ilo, this is what you see:
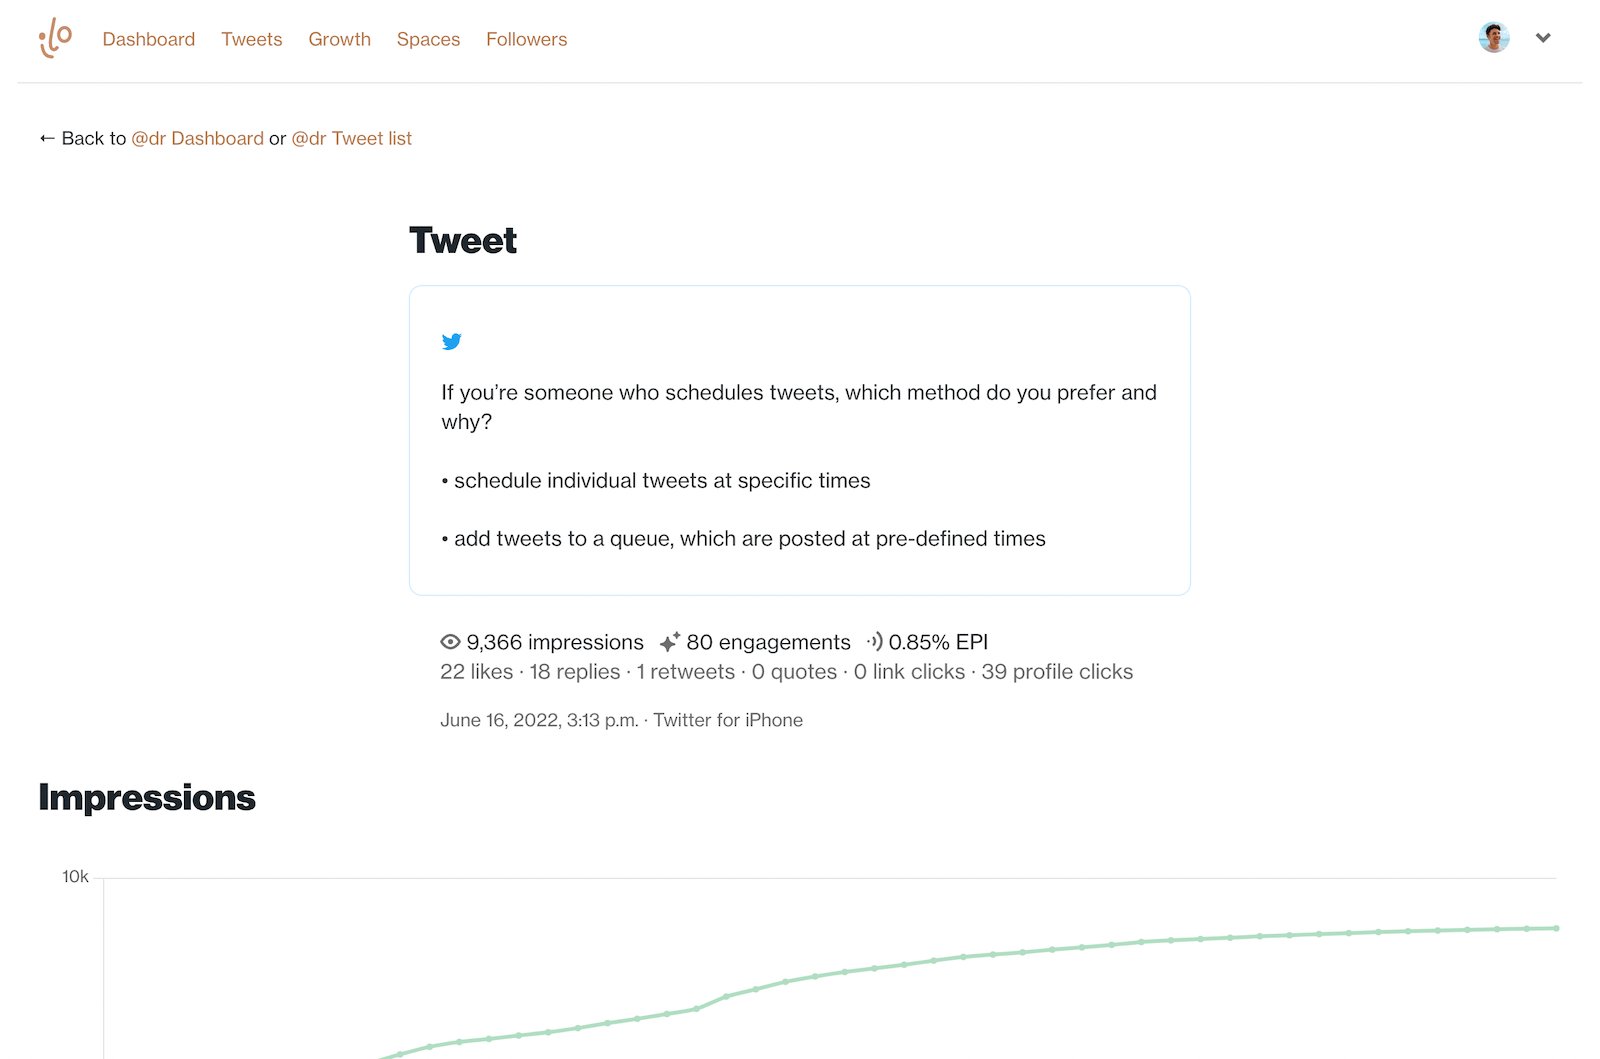
From there you can see a tweet's impressions alongside its engagement metrics broken down into likes replies, retweets, quotes, link clicks and profile clicks (much clearer that on Twitter).
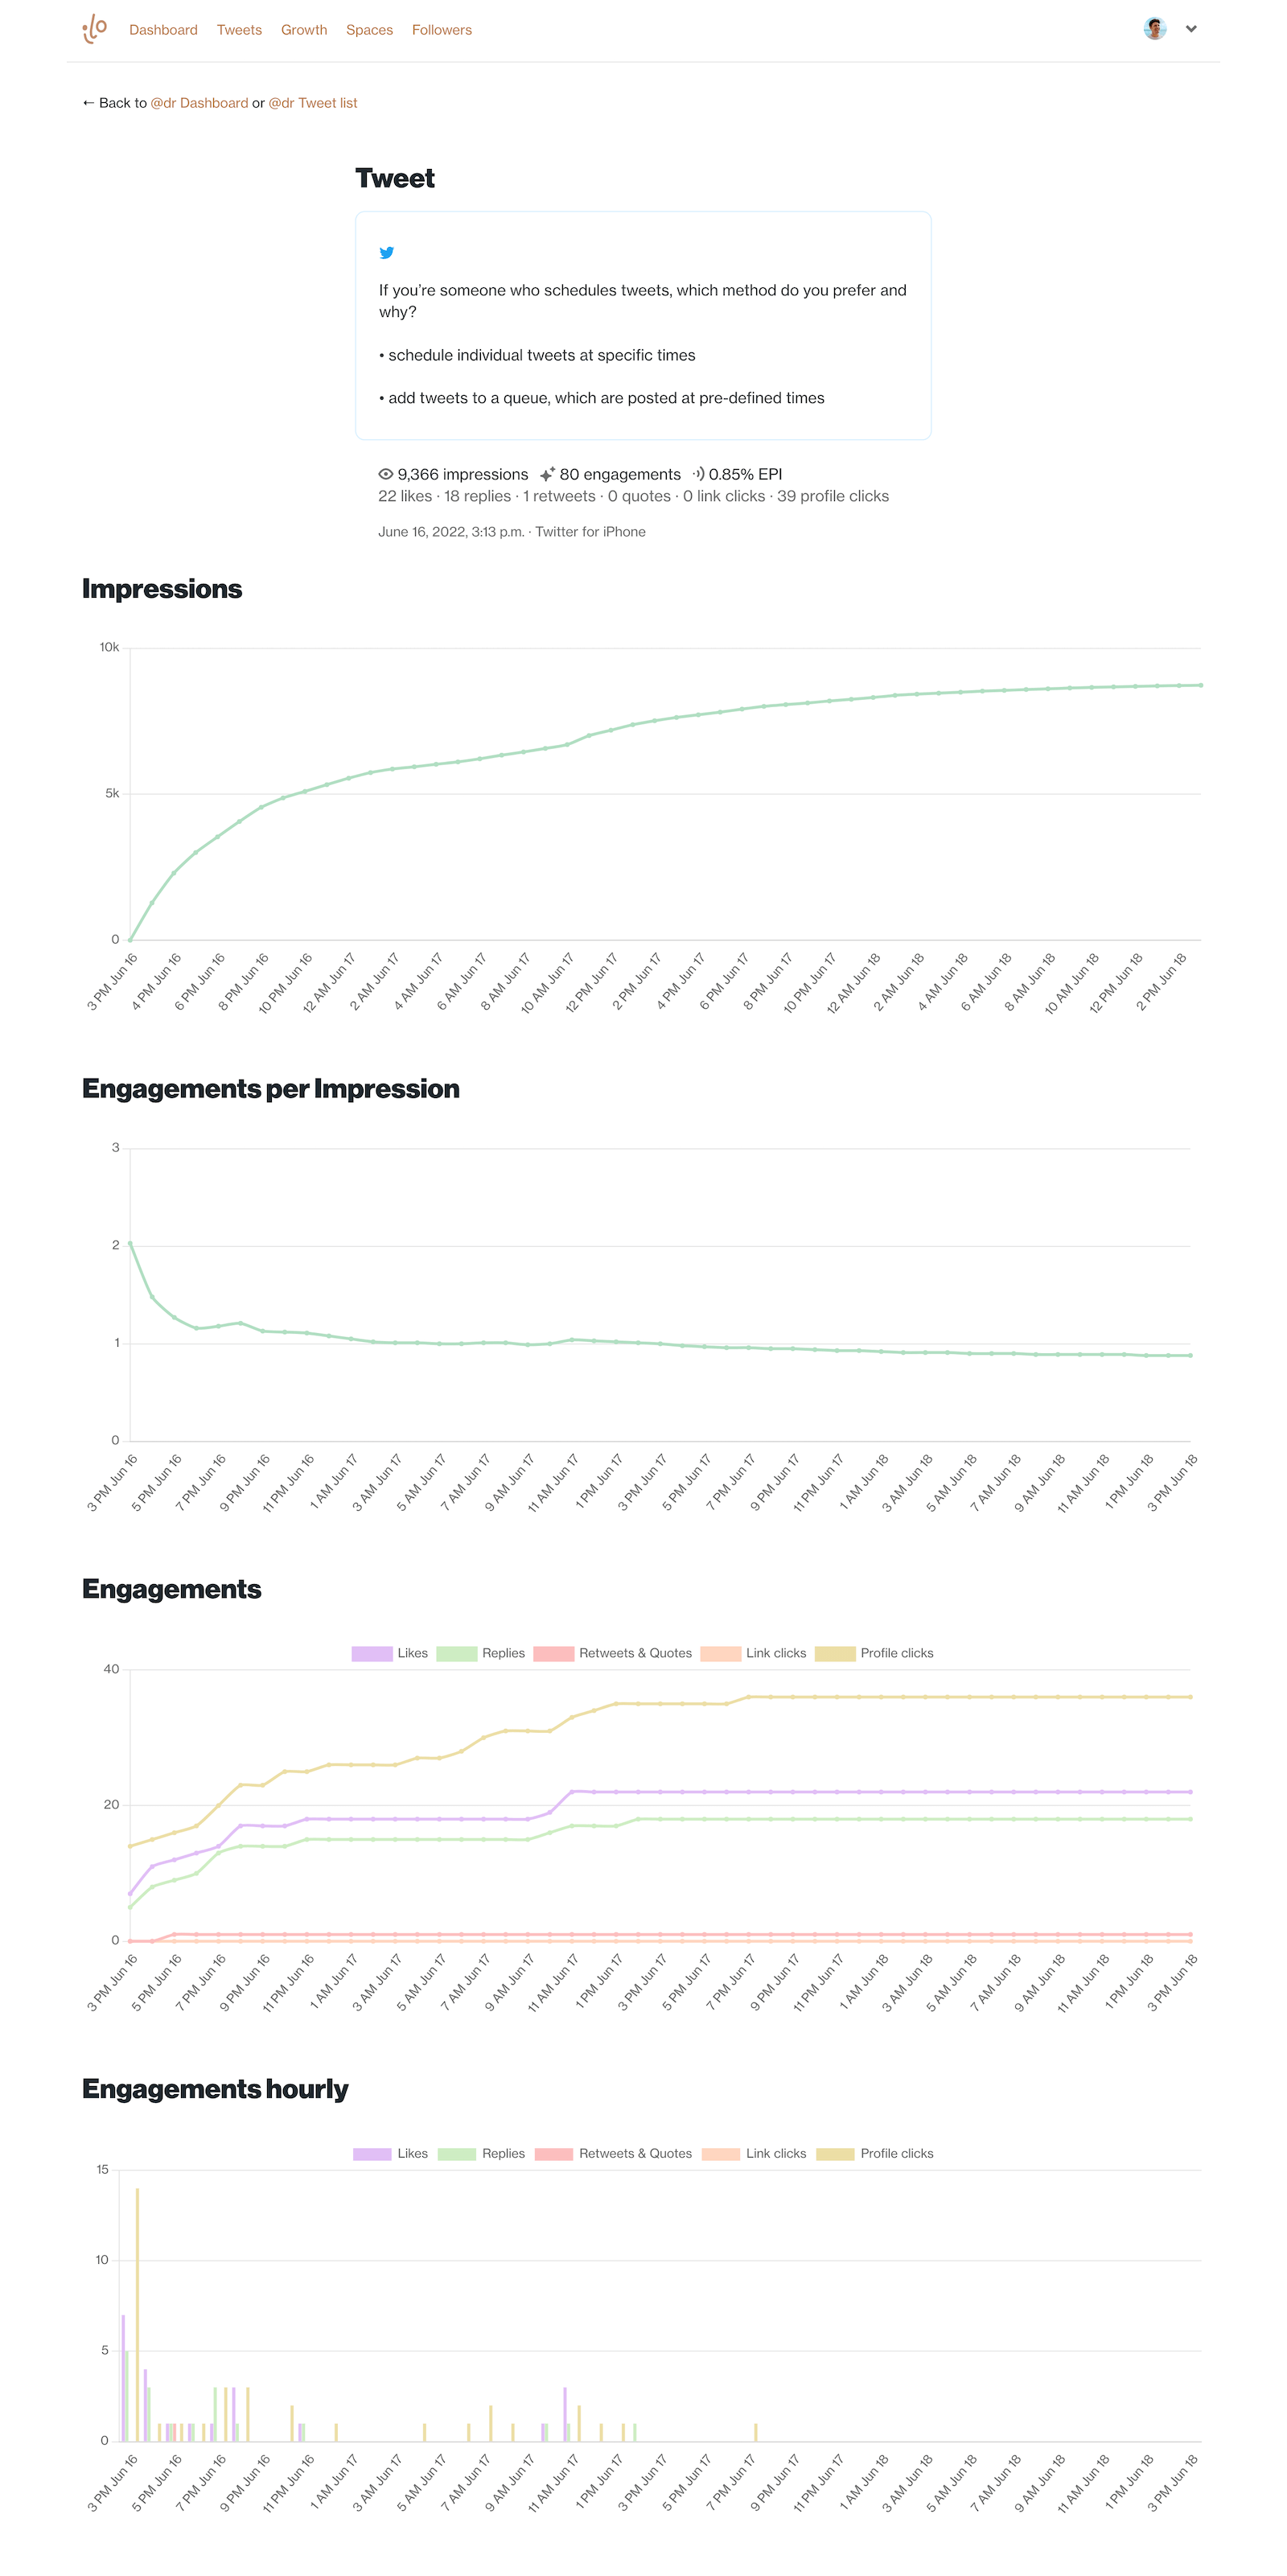
Scrolling down the page, you are also shown charts of all the impressions and engagements your tweet got over its first 48 hours.
These charts are an amazing way to see when different engagements happen. For example, you may see that a single retweet really boosted impressions.
How to view thread analytics in ilo.so
Since May 2022, ilo has also offered full-thread analytics. ilo checks your tweets for threads and collates analytics across the whole thread.
A tabular overview of each tweet shows you all the important metrics in a glance. A funnel chart shows how engagements and impressions shift down a thread. Timeline charts show how your threads perform over their first 48 hours.
ilo is the only app that can show you this information.
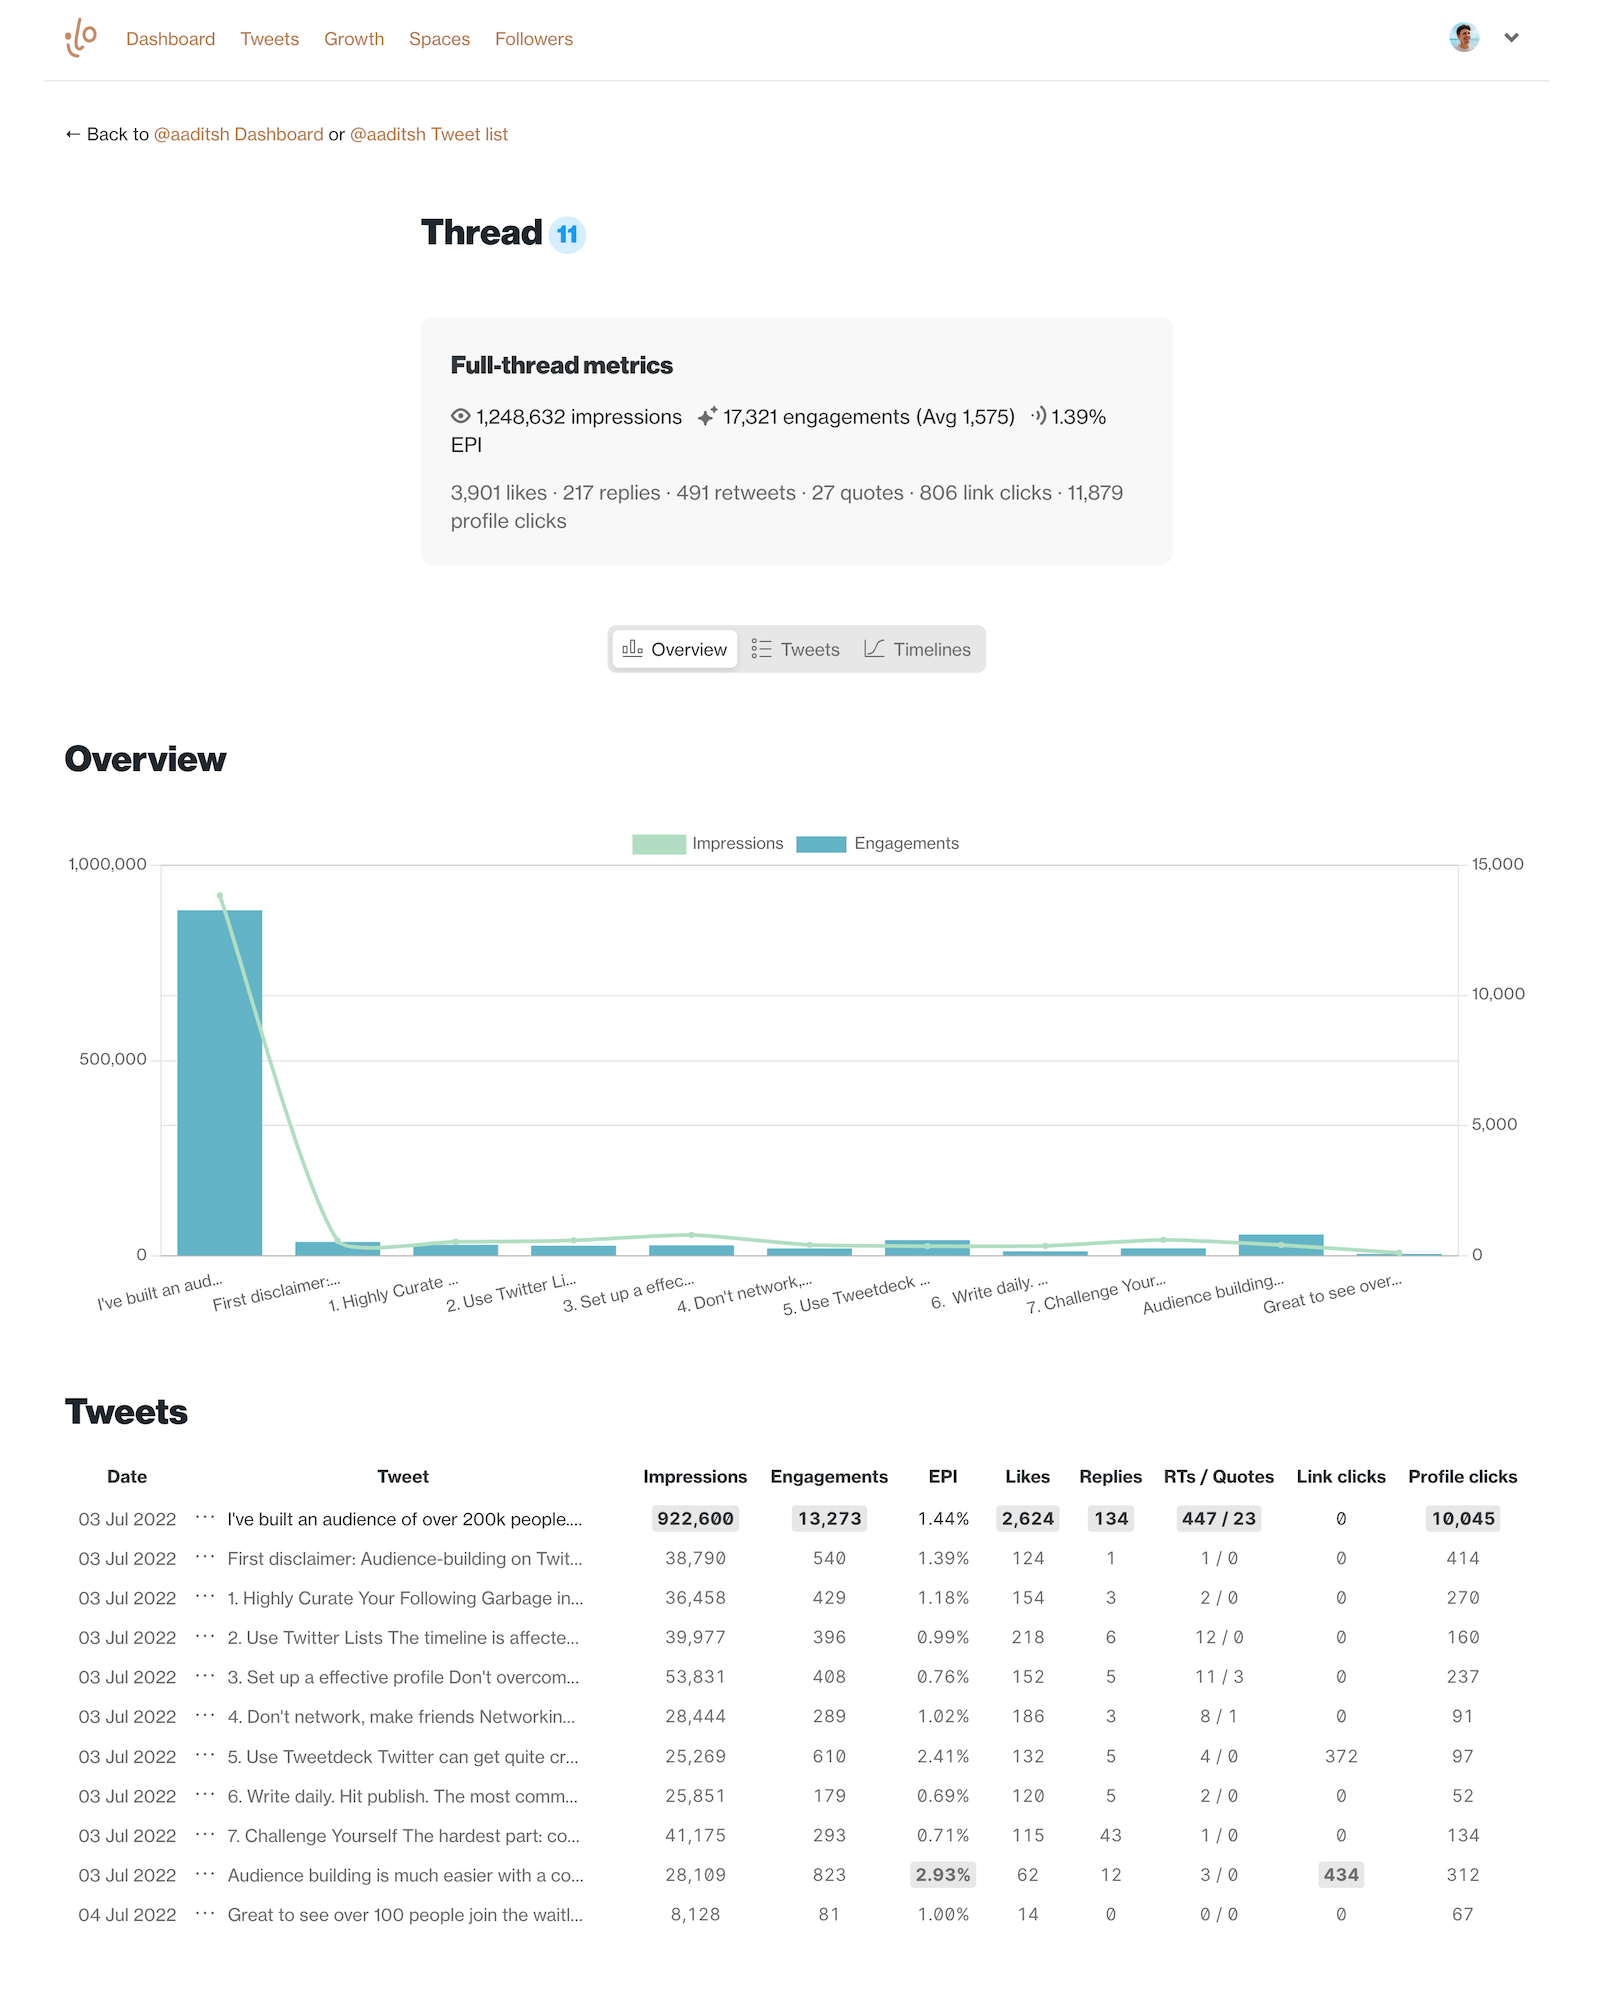
It's also really easy to compare your whole thread library in the table view.
